Showing posts with label graph. Show all posts

Tuesday, 13 March 2018

Decision trees for UK voting

The next data-analysis method I'm playing with is decision-tree regression.

It's a method often said to be included in a field of statistical computing (called machine learning, statistical learning, artificial intelligence, data mining, supervised learning, etc). Decision trees usefully split up datasets into groups, often using YES/NO questions at each split.

I'm using data from Qriously (date 2017-06-07) in the run-up to the UK general election. I'm looking only at England & Wales, and I've only considered 3 regressors: gender (0=F, 1=M), age, income. I've considered a YES/NO voting intention for the 5 biggest political parties.

The trees are below. Here are some key aspects that jump out:
  • Age seems to be the most important regressor for most parties.
  • CON seems to get many votes from older voters (except if they're poor).
  • CON gets few votes from younger votes (especially poorer voters).
  • CON's best group were older females (not males as one might expect - maybe this is simply a bias of longer life expectancy for females).
  • LAB/CON results are fairly inverted (as we might expect), i.e. poorer and younger voters favouring LAB. 
  • LAB's best group were young, poor females.
  • LAB's worst group are the 65+.
  • LIB seems to do best from low- and middle-income voters, more-so for male voters.
  • LIB's two worst groups are from (a) elderly richer females, and (b) poorer older voters.
  • GRN's voters are generally younger (the one exception being wealthier older females) -- young males is one key group.
  • GRN does badly with (a) older, poorer voters and (b) older, richer males.
  • UKIP voters are generally poorer. One key group being poorer younger males.
There are so many assumptions and drawbacks in these sorts of analyses - but anyway, interesting all the same.


CON: 


LAB: 

LIB: 

UKIP: 

GRN: 

Wednesday, 7 March 2018

Logistic regression

The next data-analysis method I'm playing with is logistic regression (LR).

It's a method often said to be included in a field of statistical computing (called machine learning, statistical learning, artificial intelligence, data mining, unsupervised learning, etc). LR is mostly used in cases of yes/no classifications.

I'm trying to use data from my previous blogs where possible. So the dataset is not really super suitable for LR (I don't believe I could really use the model result to predict the probability of future undisturbed nights of sleep) - but I'll use it anyway as a data-exploration tool. The data are taken from camera imagery of our baby/toddler's sleep each night (see earlier blog posts).


It is probably possible to estimate, by eye from the red crosses, that there have been more undisturbed nights of sleep in the later months. But the logistic regression makes it clear that there is a positive relationship - i.e. our baby/toddler is sleeping through more and more nights (apparently sleeping through most nights by the end of the year).

Tuesday, 6 March 2018

k-means clustering

I want to play with data. In this case I want to find regimes/clusters in a dataset I saw in book "The Spirit Level" from the Equality Trust. I took the data (year 2010) from GapMinder (Hans Rosling is an idol of mine!).

It's a method in a field of statistical computing (called machine learning, statistical learning, artificial intelligence, data mining, unsupervised learning, etc). The method is called k-means clustering. 'k' simply refers to the number of groups (clusters) in the dataset.

In this case the idea is that once a country reaches a certain level of wealth (about 5000-10000 USD/capita), no longer does life expectancy increase much (or at all) any more with still further increases in wealth.

k=3. When I was at school we were taught mostly about three worlds: under-developed, emerging and developed economies. So the first group includes countries like Mozambique, Malawi, Afghanistan. The second group Russia, India, Chile, China. The final group most western countries (USA, UK, Germany, etc).

k=9. Interestingly with more clusters small features start to emerge, like a group for South Africa and Botswana where increases in wealth have not translated into increases in life expectancy.

With k-means typically equal-size clusters are typical, so small clusters don't emerge, e.g. Bermuda and Luxembourg as the two most-rich per-capita countries.

Monday, 5 March 2018

k-nearest neighbour

I previously made some observations of lake depth in central Finland and plotted them in octave. I let octave use its own smoothing and interpolation between my datapoints. Now I'm curious to look a little at a simple algorithm of my own.

It's a simple method in a field of statistical computing (called machine learning, statistical learning, artificial intelligence, data mining, supervised learning, etc). The method is called k-nearest neighbours. 'k' simply refers to the number of nearest neighbours one takes into account.

Tuesday, 8 August 2017

Lake temperature in central Finland


(earlier posts 1,2 on the methods)

Thursday, 11 May 2017

Baby's sleep statistics

Here are a few graphs, made in octave, of the development of our baby's sleep in recent months.
(see my earlier post for details about _how_ the data were collected)

  1. Falling to sleep typically varies around 0-60 minutes.
    Here, we are not including the bed-time routine of food, bath, soft music, turn lights down, pyjamas, etc. So here is an estimate of the time from first trying to put the baby down in the cot until asleep (i.e. no major movements). 
  2. Bedtime varies between 7 and 10pm, but clearly depends a lot when us parents chose to try to put the baby to sleep (hence there being many nights just after 8pm).
  3. Wake-up time varies between 5 and 8am.
    Again, is the baby wakes before 5am, we try hard to put her back to sleep - hence nothing before 5am.
  4. Sleep duration varies between 8 and 12 hours per night.
  5. The number of wakes per night varies between about 0 and 8.
    Yes, the baby sometimes sleeps _all night_ without waking.


Wednesday, 1 March 2017

Sleep tracker for baby

Aim: Track baby's sleep using images from baby monitor.

Camera: D-Link DCS-825L
   Example image 17.5 kb, 640x352 pixels, 96x96dpi, 24bit.


Method, use the change in image filesize as a proxy for baby movement:
  • Capture image using wget from local network 192.168.1.2/image/jpeg.cgi
  • Crop the image using mogrify (imagemagick) to remove date and time from image.
  • An artefact of the above makes night-vision jpeg images in greyscale (and keeps lighted images in colour); we'll see later that this is useful metadata.
  • Repeat as often as possible (e.g. every second); although maybe it is possible to overload the camera.
  • Write to file with columns: Year, Month, Day, Hour, Minute, Seconds, FileSize, Greyscale

Analysis
  • The jpeg filesize varies from 0 to about 130 bytes from second to second, even with no movement.
  • Baby movements gives up to 400 bytes of variation.
  • Adult movement gives many hundreds or thousands of bytes of filesize changes.
  • We can cut off the awake-time evening and morning data when the night-vision was off (this is presumably when an adult was in the room putting the baby to sleep and collecting the baby in the morning).
  • Each morning plot (using octave) the night's movements:
    • Sleep was from 9pm until 7am, with help from parents around 04:30 to 05:00 (plus baby's own movements around 10pm, midnight, 2am, 4am):


Useful link:
  • D-Link forum: http://forums.dlink.com/index.php?board=427.0

Monday, 16 January 2017

Automated capture of radio communications

PART 2
(see also earlier blog post about this)

Aim: to log lake temperature

Method: similar to before, but with new device.

Device:
 * "SODIAL(R) New Wireless Digital Floating Swimming Pool Thermometer Bath Spa Temperature" bought from Amazon
 * Example result for 13.0degC was 01011000 01111010 00010010 10011111 10101111 00110011 1

Other notes on message:
 - there's a 'calibration' set of 8 before the main message
 - Then a long time at "1"
 - Then a long time at zero
 - Then main message
 - The start of each bit jumps from 0 to 1
 - After each bit there is a jump from 1 to 0
 - The 0 "on" is longer than the 1 "on"
 - The bits seem to be of different widths for "1" and "0"


Decoding:
  * Calibrated from 4 temperatures between 3 and 31degC. A linear relationship found between temperature and bits 15-24 (T = mx + c, where T is temperature (degC), m=0.1, c=-40, and x is the message in bits 15-24).

In Linux or Windows (or even Raspberry Pi):
    rtl_sdr -s 1e6 -n 3.2e7 -f 433.85e6 -g 40 output.dat
This should create a 32-second data sample at 433.85 MHz with a gain of 40dB and save the file to "output.dat".


In Octave:
  fid = fopen('output.dat','rb'); 
  y = fread(fid,'uint8=>double'); 
  y = y-127.5; 
  y = y(1:2:end) + i*y(2:2:end); 
  plot(abs(y));

Then many lines of Octave code to interpret and clean signal,
and then writes result to data log file with each row as follows: Year,Month,Day,Hour,Minute,Temperature(degC)


Helpful websites included:
  • http://electronics.stackexchange.com/questions/145714/what-encoding-is-used-in-this-signal
  • http://sdr.osmocom.org/trac/wiki/rtl-sdr
  • http://aaronscher.com/wireless_com_SDR/RTL_SDR_AM_spectrum_demod.html 

Wednesday, 4 January 2017

Moisture indoors

In Finland in winter, the indoor air is normally so dry that it causes problems with cracking/itchy skin. Ideal indoor moisture should be 30-50% relative humidity (NB. too high RH causes damp/mould), but easily indoor RH can get down to 10% in cold spells in Finland.

I have bought a sonic humidifier that has a 1 litre capacity and takes about a day to emit this moisture into the air. I want to know roughly how much effect this might have.

I'm going to ignore effects of sources/sinks/storage like showers/cooking/washing/ventilation.

If we imagine a starting point of 20C and 25% RH, then this is about 4 g/m^3.


Now let's imagine instantaneously and evenly adding all that 1 litre (1000 g) of water into the air in my flat (72 m^2 and about 3m tall, so volume of about 216m^3). This would be adding 1000/216 = 4.6 g/m^3.

So we would be roughly doubling the moisture content, and the RH would increase to about 50%. This would be a great result.

Future blog update...estimate the effect of time on this scenario by looking at the rate at which the humidifier works and the rate of ventilation in/out of the flat...

Sunday, 25 September 2016

Obtaining and deciphering radio messages


Aim: to obtain and decipher radio messages from household devices.

Test device: Clas Ohlson (WS2015) temperature sensor - typical household 433MHz device.

Receiver: USB dongle (e.g. hsy® USB 2.0 Digital-DVB-T-DAB FM RTL2832U FC0013B SDR TV Radio Receiver-Stick) on a Windows laptop.

Data study and capture: SDR# (SDR sharp), 8bit wave file made of a couple of seconds and filesize of a few megabytes.

Understanding the data: each clock-cycle has a level shift (0/1). Logic1 has a level shift within a clock cycle, whilst logic0 does not. Bits 21-35 are temperature (scaled as +50 x 128). Useful website was http://ala-paavola.fi/jaakko/doku.php?id=wt450h

Data processing: done 'myself' in Octave -- the key command was wavread('FILENAME.wav'). But also some 'debouncing' was done to infill the many dropped "1" values. Plus all of the 6 messages were taken (2 channels, 3 messages per channel) after some synchronizing.

Hardware:
  
Software, SDR#:

Software, Octave:
Each minute 3 near-identical 36-bit messages sent:
  
Example, zoom in on first 5 bits of first message (notice the many 'dropped' "1" values): 
 
After tidying and then converting the binary message to a normal (decimal) value the result is found: 


See also Part 2


Tuesday, 13 September 2016

Winter wonderland

All winters are cold and snowy in Finland, but some much more than others.

Weather station at Helsinki Airport in Vantaa.
"Cold days" are with maximum temperature below 0C.
"Snow days" are simply days with at least some snow on the ground.
Winters are shown such that e.g. "2010" on the graph means the winter of 2009/10 (e.g. November 2009 --  April 2010).

Source: Finnish Meteorological Institute.

Summer days

I had the impression that this year had lovely summery weather. it did, and I enjoyed it lots. But apparently it was only about the same as the long-term (30-yr) average (of about 50 days per year), and even this year was cooler than some of the recent warmer summers that Helsinki's had in the last decade or so.
Weather station at Helsinki Airport in Vantaa.
"BBQ days" are with maximum temperature above 18C, at least 4 hours of sunshine and no rain.
"Hot days" are with maximum temperature above 25C.

Source: Finnish Meteorological Institute.

Tuesday, 5 July 2016

It doesn't rain as often as we think.

It doesn't rain on me very often going to work. I wanted to know how often it happens...


It's dry a lot of the time: for 88% of all 10-min periods and 81% of all 1-hour periods. Although the statistics for 24-hours looks less good - only 37% of days are completely dry.

My bike-ride to work is 5 minutes each way. So there's an 88% chance of being dry each day when I go to work - i.e. it'll rain on me on about only 2-3 days per month. 

I also looked at Helsinki (Vantaa) airport 1985-2015 for a few more things PER YEAR: 
  • 52 BBQ days (Tmax>18C, sun>4hrs, rain=0) 
  • 17 hot days (Tmax>25C) 
  • 85 gloomy days (sun=0, rain>0) 
  • 70 cold days (Tmax<0) 


Tuesday, 1 September 2015

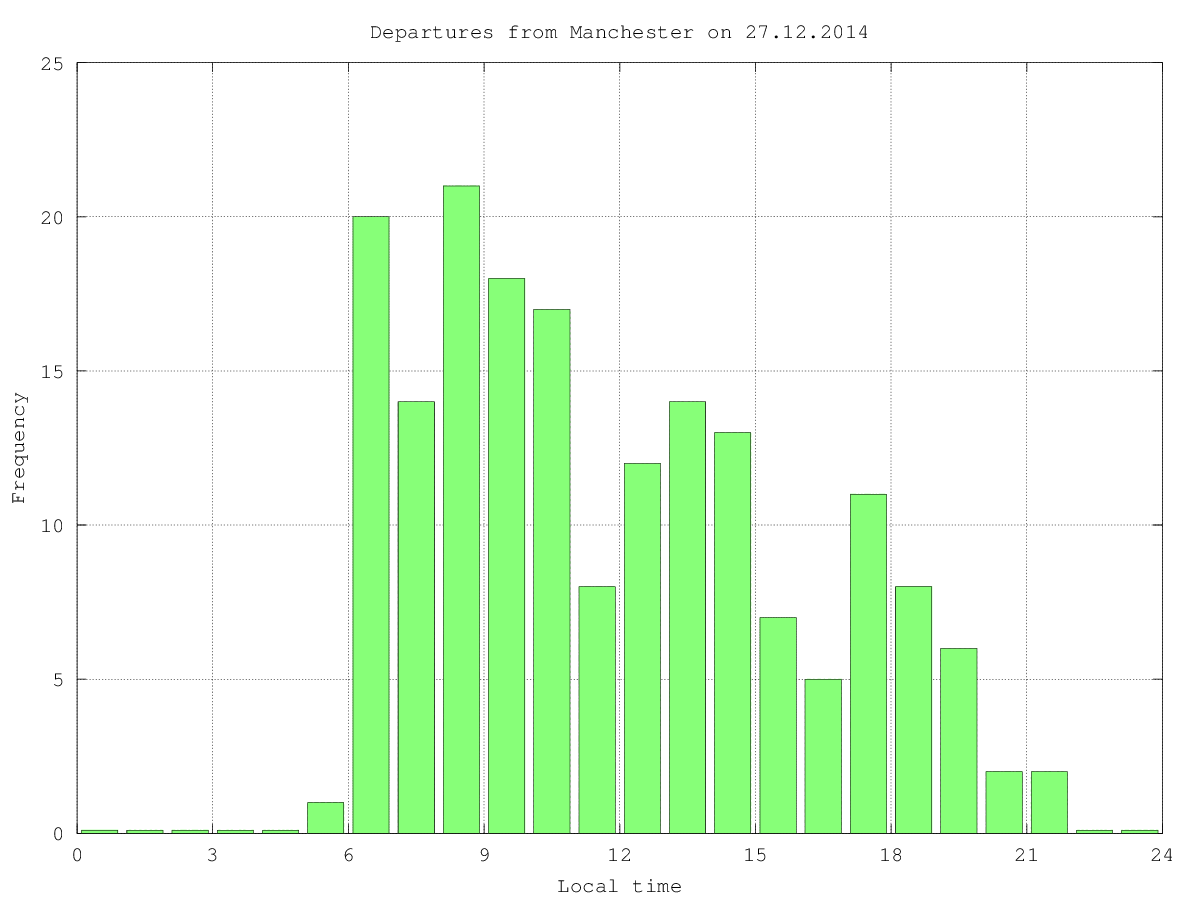
Flight times


I recently came across these that I made last Christmas. It's one way to pass time in an airport...


Sunday, 30 August 2015

English speakers in Europe


  • Overall no big surprise: more English-language speakers in north and west Europe.
  • I was surprised how 'low' Finland was. But I am perhaps biased by living in Helsinki!


Data source: https://en.wikipedia.org/wiki/List_of_countries_by_English-speaking_population

Friday, 28 August 2015

Sunshine in UK and Finland

  • Not only is there less daylight, but also it is much more cloudy in winter. Thus sunny less than 20% of the time!
  • The spring and summer is quite nice though - sunshine around 50% of the time.
  • For comparison, the south cost of Spain has around 60-70% of sunshine (most in summer).
Data sources: http://en.ilmatieteenlaitos.fi/climate, http://www.metoffice.gov.uk/climate

Friday, 21 August 2015

The sit-and-reach test


Some conclusions:
  1. Youth and females have greater flexibility than elders and males (perhaps obvious).
  2. For my group (33-year-old males) the 50-50 point by coincidence is '0 cm', i.e. touching one's toes. Meaning that about half cannot reach their toes (although 80% of young girls can!). 
  3. As for my own story, I used to be 13 cms short of my toes. This meant that I was at about the 20% mark (4 out of 5 men could reach further than I could). BUT NOW, after weeks of exercise, I can exceed my toes by 7 cms - this means that I am over the 60% mark and only 2 out of 5 men can reach further than I can!

Data source: http://www.exrx.net/Calculators/SitReach.html
Image source: http://oncourt.ca/news/wp-content/uploads/2013/05/1.jpg